Plots and images
image converter is very useful tool to quickly inspect simulation results.
It accepts data with any 1-D and 2-D scoring grid and is producing images in PNG format with plots.
Conversion is done using standard command:
convertmc image --many "*.bdo"
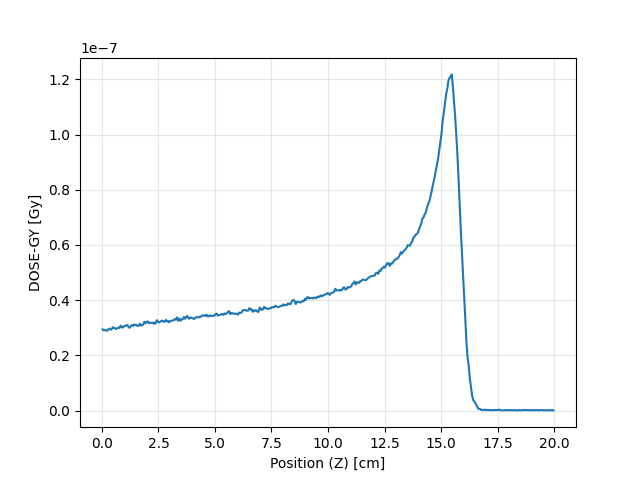
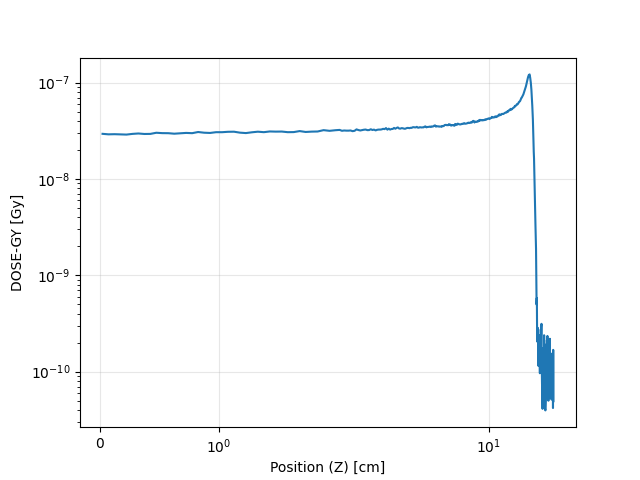
After converting data with 1-D scoring grid, following plot can be generated:
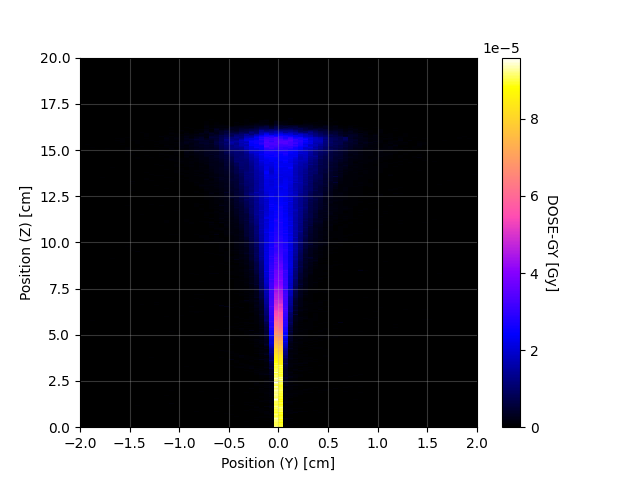
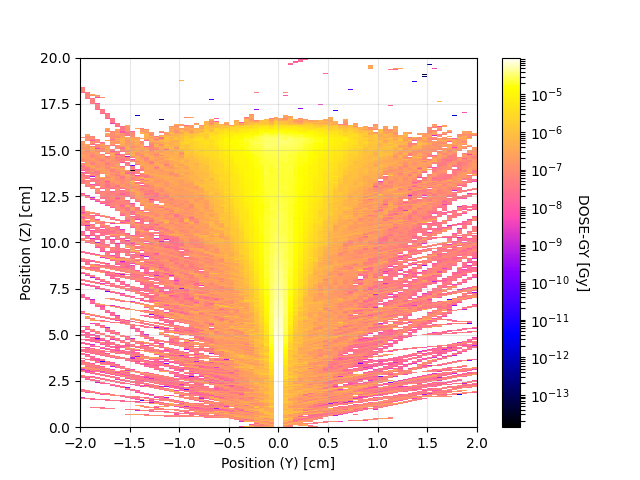
Data containing 2-D scoring grid are visualised as heatmap with color denoting scored value.
Options
Logarithmic scale
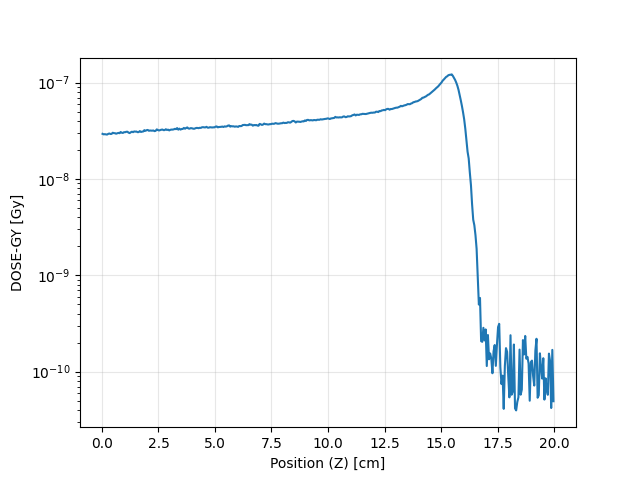
User can also set logscale on one or more axis in the plots using –log option.
An example plot with logarithmic scale on Y axis:
convertmc image --many "*.bdo" --log y
Scale can be also change on two axis at once:
convertmc image --many "*.bdo" --log x y
An example plot with 2-D heatmap and logarithmic scale on Z (color) axis:
convertmc image --many "*.bdo" --log z
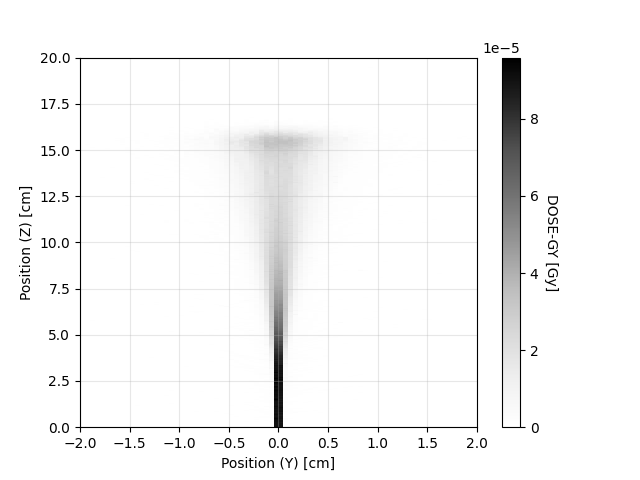
Colormap
When generating 2D heatmaps it is also possible to specify colormap. List of available colormaps is available here: https://matplotlib.org/stable/tutorials/colors/colormaps.html. By default colormap called gnuplot2 is used. An example plot obtained with other colormap (Greys) can be obtained with following command:
convertmc image --many "*.bdo" --colormap Greys